Crag to Competition
This is my term project for Introduction to Data Science (DSA 210) course in Sabancı University, Turkey
Does Outdoor Sport Climbing Translate to Competitive Success?
Motivation
Climbing is a rapidly growing sport, with distinct communities in outdoor sport climbing and indoor competitive climbing (e.g., bouldering and lead climbing). As a climber myself and an avid follower of International Federation of Sport Climbing (IFSC) competitions, I’ve often wondered how performance in outdoor sport climbing correlates with success in formal competitions, such as those organized by IFSC. This project aims to explore whether skills and achievements in outdoor sport climbing, as logged by climbers on platforms like 8a.nu, translate to competitive performance in IFSC boulder and lead climbing events.
Data Collection
Data Sources

This project combines data from two primary sources: the International Federation of Sport Climbing (IFSC) for competition performance metrics, and 8a.nu for outdoor climbing achievements.
Data Collection Process
The data collection process consisted of four main steps:
-
Scraping IFSC Rankings: Extracted climber information from the IFSC athlete rankings page using Python (
requests,BeautifulSoup), collecting names, countries, gender, and points across boulder, lead, and combined disciplines. -
Finding IFSC Climbers on 8a.nu: Used fuzzy string matching techniques to identify IFSC competitors’ profiles on the 8a.nu platform, accounting for variations in name formatting and spelling.
-
Scraping 8a.nu Profiles: Employed Selenium to scrape outdoor climbing data from matched profiles, extracting highest grade climbed, count of 8c+ ascents, and average grade of first 5 unique ascents.
-
Data Merging: Combined IFSC competition data with 8a.nu outdoor climbing metrics, resulting in a final dataset of 551 climbers with both competition and outdoor climbing performance data.
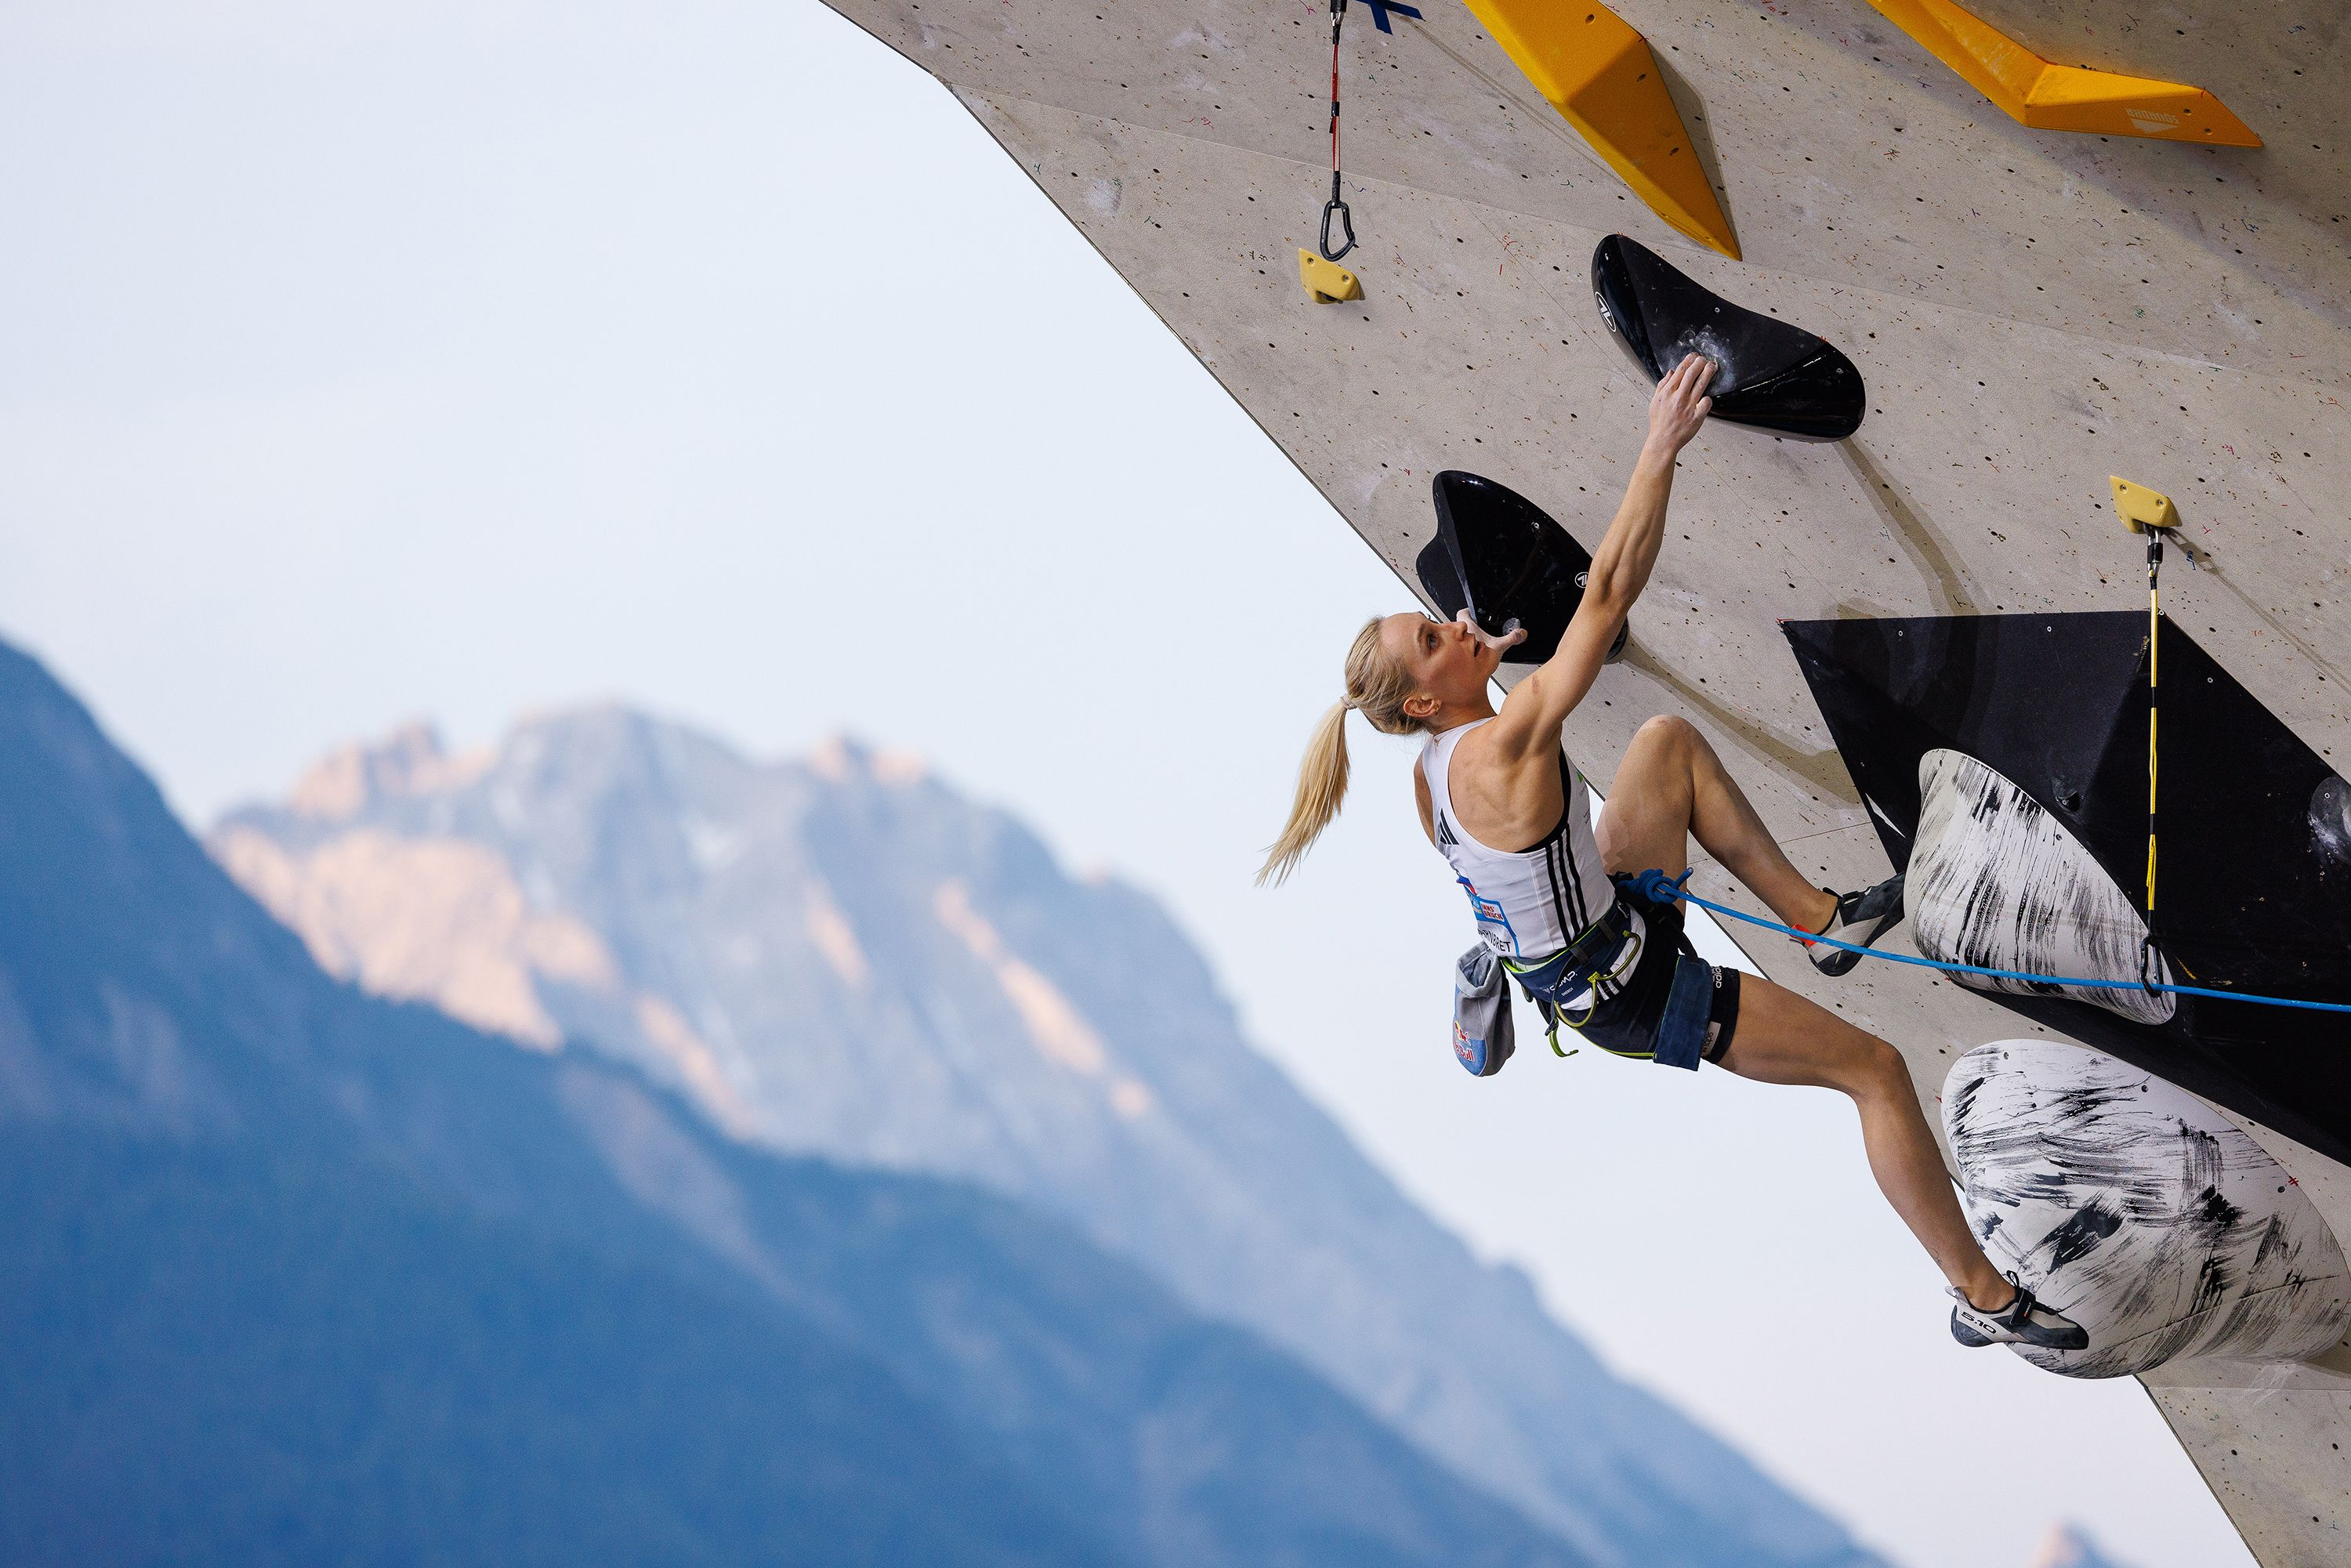
Janja Garnbret in IFSC Climbing World Cup on June 18, 2023 in Innsbruck, Austria. Marco Kost/Getty Images
Analysis
Exploratory Data Analysis
Dataset Overview
The scraped data contains 551 climbers in total with significant variation in participation across disciplines and outdoor climbing activity:
Competition Participation:
- 429 climbers competed in bouldering
- 316 climbers competed in lead
- 195 climbers competed in combined
Profile Data:
- Out of the 551 climbers, only 157 have an 8a.nu profile
- Of those, only 61 have an ascent grade of 8c+ or above
Handling Missing Data
The data contains high percentages of missing values for two main reasons:
- Climbers not participating in specific disciplines (boulder_points, lead_points, combined_points)
- Climbers not having an 8a.nu account (highest_grade, count_8c_plus, avg_grade_first5)
Due to the nature of these missing values, imputation was not viable. Instead, the data was segmented by discipline and outdoor climbing participation. Missing values were treated as zeros, representing either non-participation or absence of outdoor climbing data.
Distribution Analysis
Competition points across all disciplines showed highly right-skewed distributions, with most values clustered at lower scores and long tails extending to maximum values. This skewness reflects both performance variation and competition attendance frequency—climbers who compete more often accumulate more points.
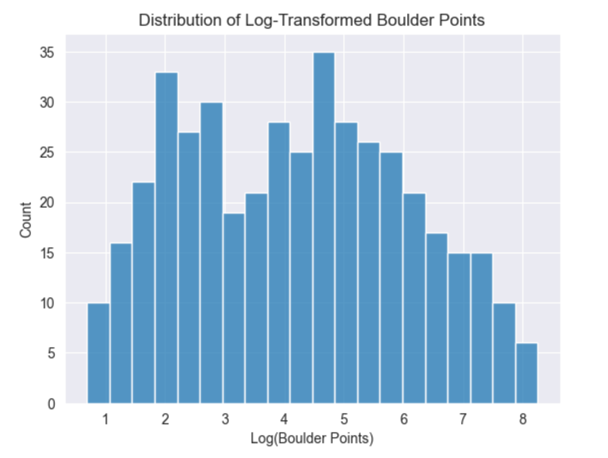
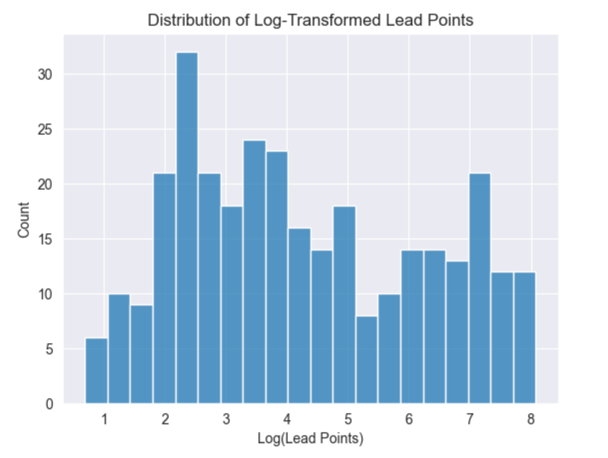
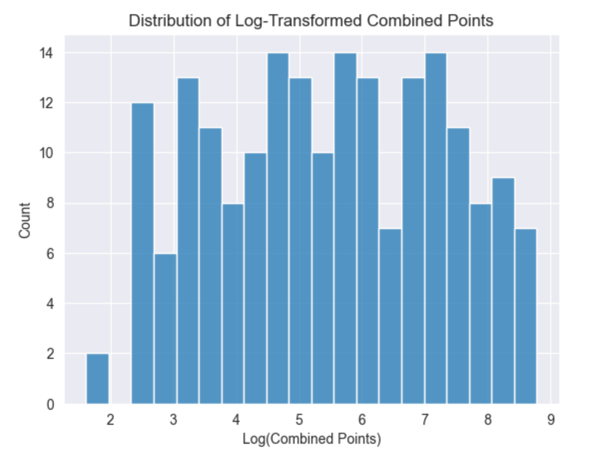
The boulder_points data ranges from 0 to 3380, with most values below 1000. Lead and combined disciplines show similar skew patterns for the same underlying reasons. To address this skewness in subsequent analysis, log transformations were applied to normalize the distributions.
Regional Analysis
Performance patterns were examined across different geographic regions to understand global climbing trends:
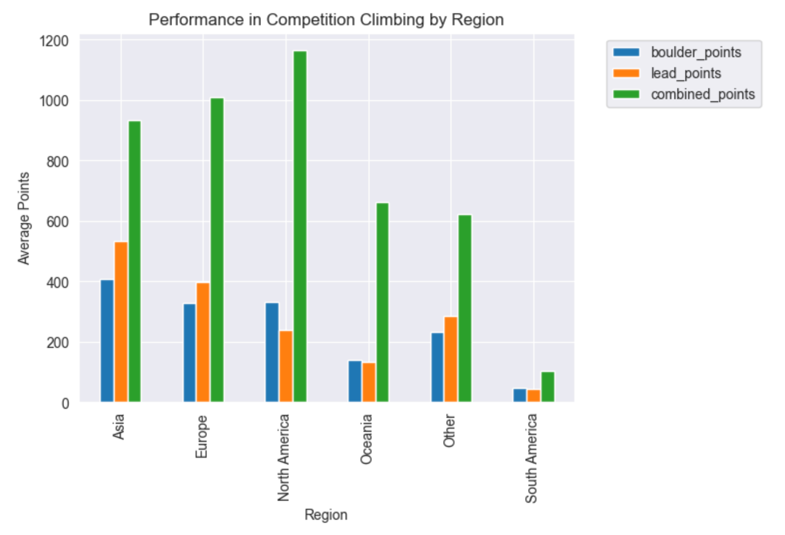
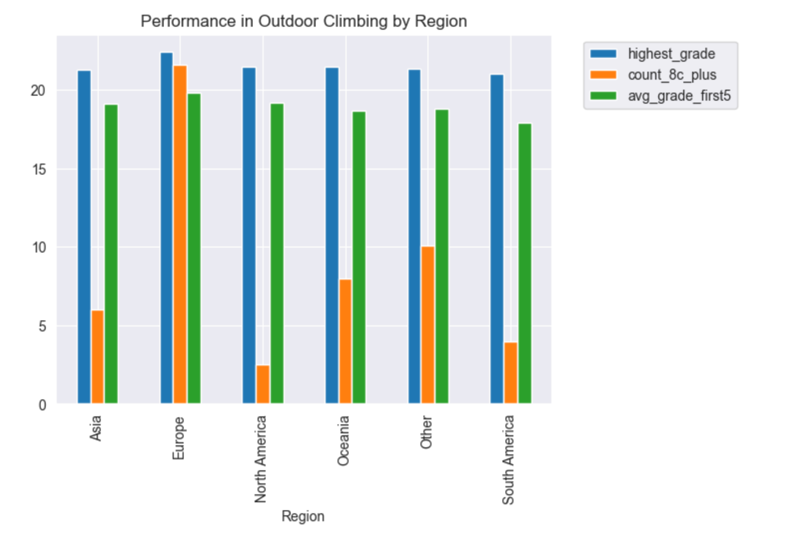
Regional analysis revealed variations in both competition participation and outdoor climbing achievement across different countries and continents.
Correlation Analysis
The relationship between outdoor and competition climbing was explored through correlation heatmaps and pairplot visualizations:
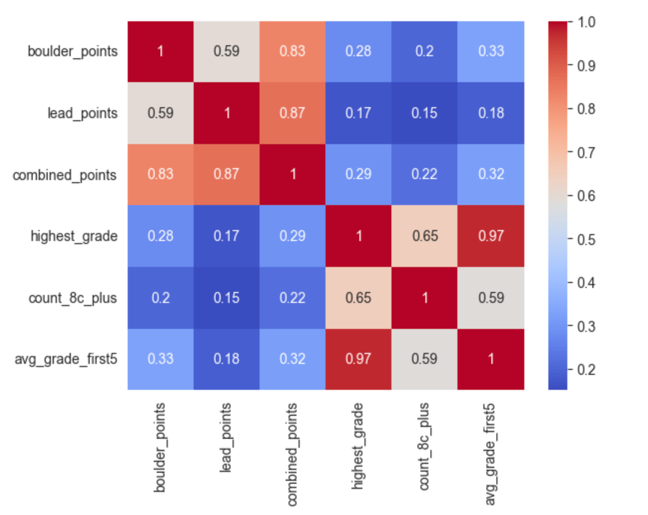
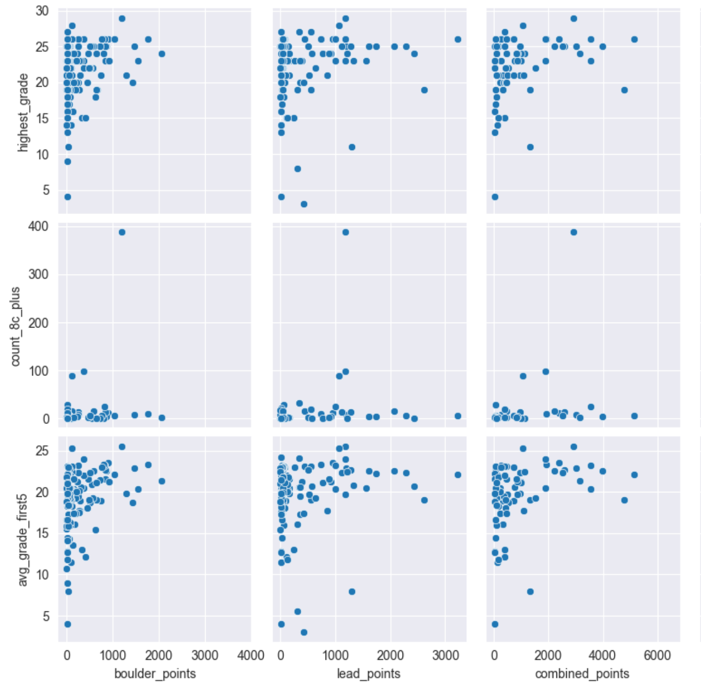
The heatmap reveals modest correlations between competition points and outdoor climbing metrics. However, stronger correlations appear within competition disciplines themselves and among outdoor climbing metrics. The statistical significance of these observed correlations was formally tested in the hypothesis testing phase.
Hypothesis Testing
Statistical analysis was conducted across five key research hypotheses:
-
8c+ Benchmark vs Competition Performance: Two-sample t-tests demonstrated that climbers with 8c+ ascents significantly outperform those without across all disciplines, with the strongest effects observed in lead and combined formats.
-
Highest Outdoor Grade vs Competition Performance: Pearson correlation tests revealed statistically significant moderate positive correlations for bouldering and combined disciplines, but no significant correlation for lead climbing specifically.
-
Average Outdoor Grade vs Competition Performance: Significant but modest correlations were found across all disciplines, with the strongest relationship appearing in bouldering competition performance.
-
Inter-discipline Competition Correlations: Strong correlations between all IFSC disciplines indicated substantial overlap in required skillsets across different competition formats.
-
Outdoor Metrics Correlations: Strong correlation between highest grade achieved and average grade demonstrated consistency in outdoor climbing performance across athletes.
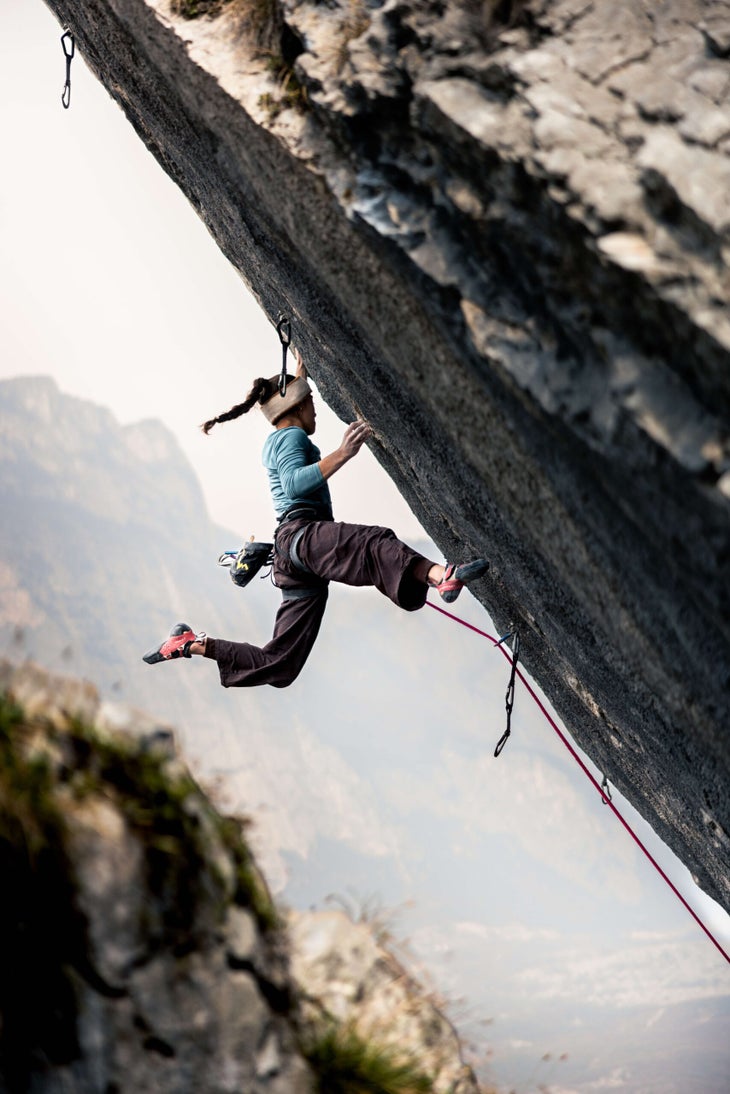
Brooke Raboutou climbing Excalibur, becoming the first woman to climb 5.15c
Machine Learning
Machine Learning models were developed to predict a climber’s performance in a selected IFSC discipline; bouldering, lead, or combined using their climbing performance in competitions and outdoors.
Two regression models are implemented to perform this task:
- Linear Regression
- XGBoost Regressor
Given the small size of the dataset, the models are evaluated using multiple cross-validation methods:
- 5-Fold Cross-Validation
- 10-Fold Cross-Validation
- Leave-One-Out Cross-Validation
For the XGBoost model, hyperparameter tuning is performed using GridSearchCV, selecting the best parameter combination based on cross-validated performance.
Results
For the combined discipline the results were:
Value Range: 0.00 to 6508.00
| Model | Cross-Validation Method | RMSE |
|---|---|---|
| Baseline (Mean Guess) | - | 879.60 |
| Linear Regression | 5-Fold CV | 449.02 |
| Linear Regression | 10-Fold CV | 450.43 |
| Linear Regression | Leave-One-Out CV | 223.03 |
| XGBoost | 5-Fold CV | 347.33 |
| XGBoost | 10-Fold CV | 297.63 |
| XGBoost | Leave-One-Out CV | 88.45 |
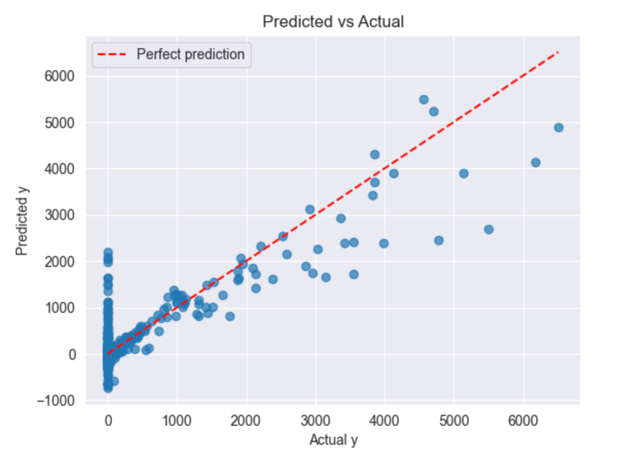
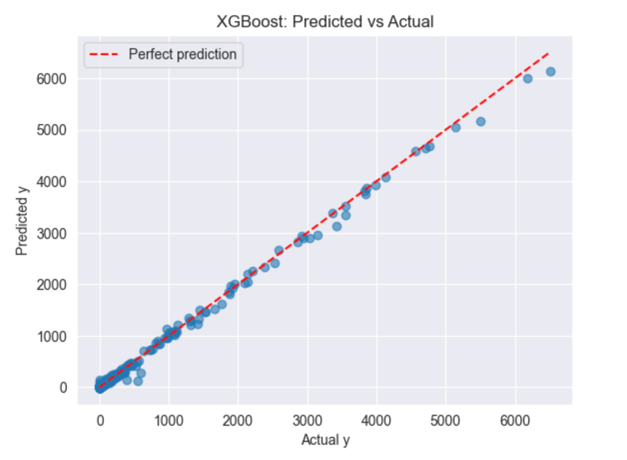
The results show that XGBoost consistently outperforms Linear Regression across all cross-validation methods, with particularly strong performance in Leave-One-Out CV (RMSE of 88.45 vs 223.03 for Linear Regression).
Limitations and Future Work
- Small dataset: 551 climbers limits analysis and model robustness
- Limited IFSC features: Could scrape additional athlete data (age, experience, competition history) from individual athlete pages
- IFSC athlete profile URLs require unique IDs not easily derivable from rankings
- Ranking vs. points: Average ranking might be more meaningful than total points, which depends on the number of competitions
- Outdoor scope: Analysis limited to sport climbing; 8a.nu scraping could include outdoor bouldering data